Data Mart Modeling Review (First Activation Funnel Metrics)
“This post summarizes my experience designing and building a data mart to effectively provide new user activation conversion metrics. I designed the data model to flexibly respond to changing business requirements, and focused on queries and structures that are immediately applicable in practice. Through this process, I was able to apply data modeling theory to real-world problem solving and once again realized the importance of deeply understanding requirements.”
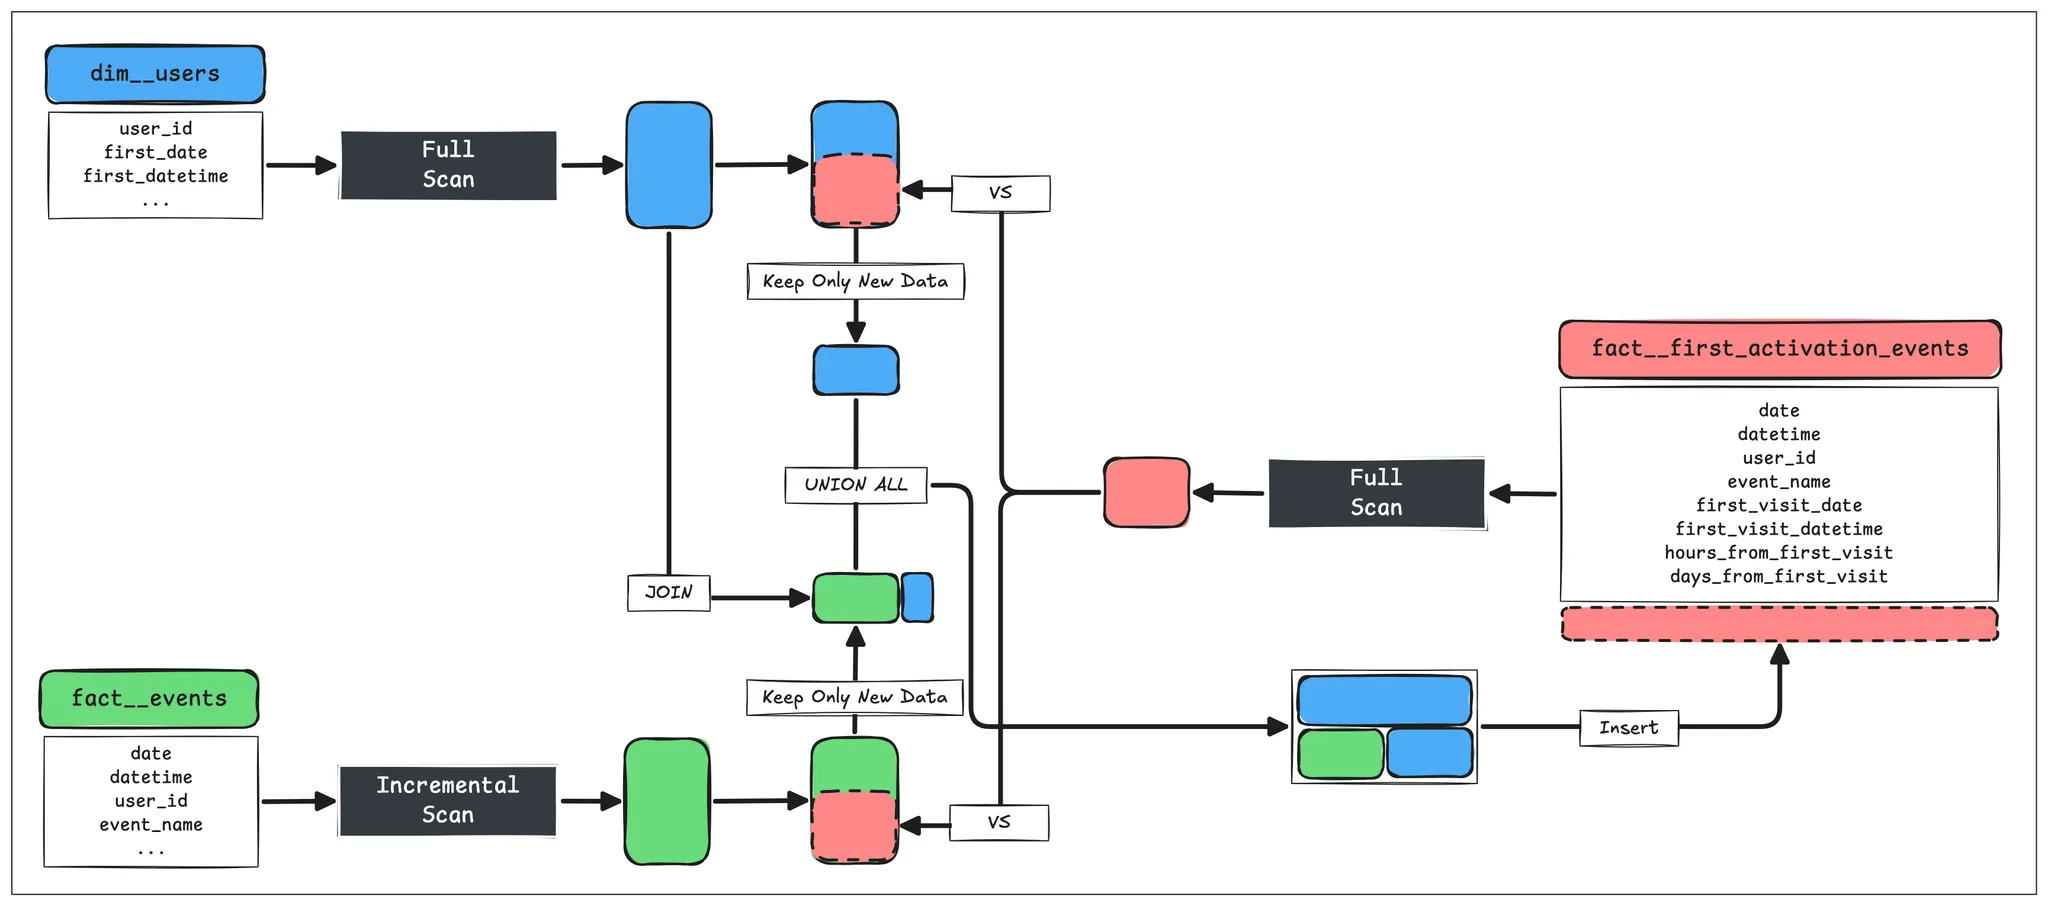
Table of Contents
- The Squad Organization Was Launched!
- 1.1. Background
- 1.2. Core Metrics of the Squad
- 1.3. What the Data Analyst Needs to Do
- What I Needed to Do
- 2.1. Reflecting on the Core Metrics
- 2.2. Let’s Build a Data Mart!
- A Preview of the Data Mart
- 3.1.
dim__users - 3.2.
fact__first_activation_events - 3.3. Example Records
- 3.4. Key Features
- 3.1.
- Example Queries
- 4.1. Designed for Usability
- 4.2. Beginner Query
- 4.3. Intermediate Query
- 4.4. Advanced Query
- How the Modeling Was Done
- 5.1. [STEP 1] Load the Entire
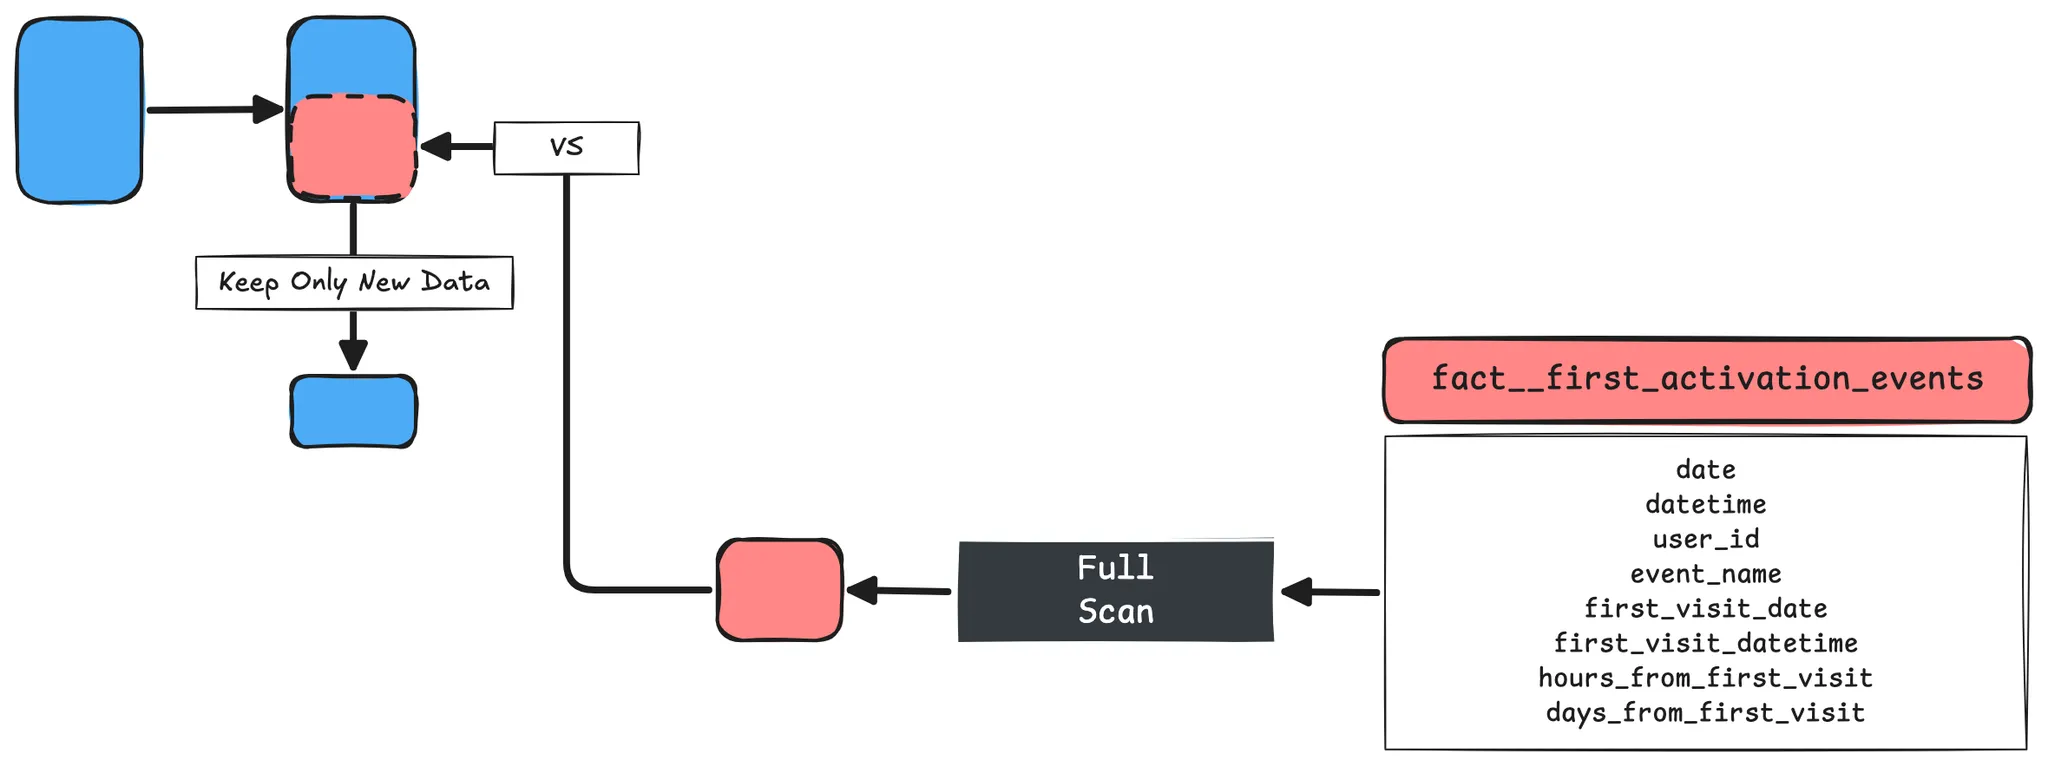
dim__usersTable - 5.2. [STEP 2] Keep Only New
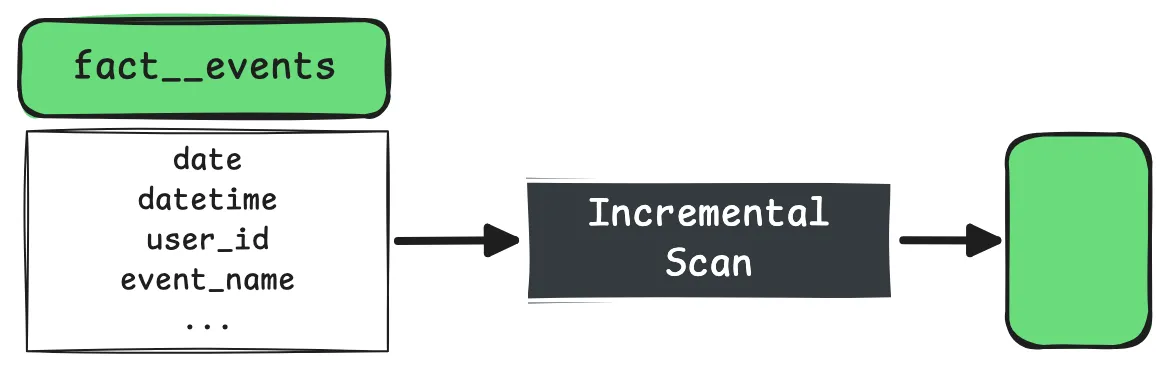
first_visitData - 5.3. [STEP 3] Incrementally Load the
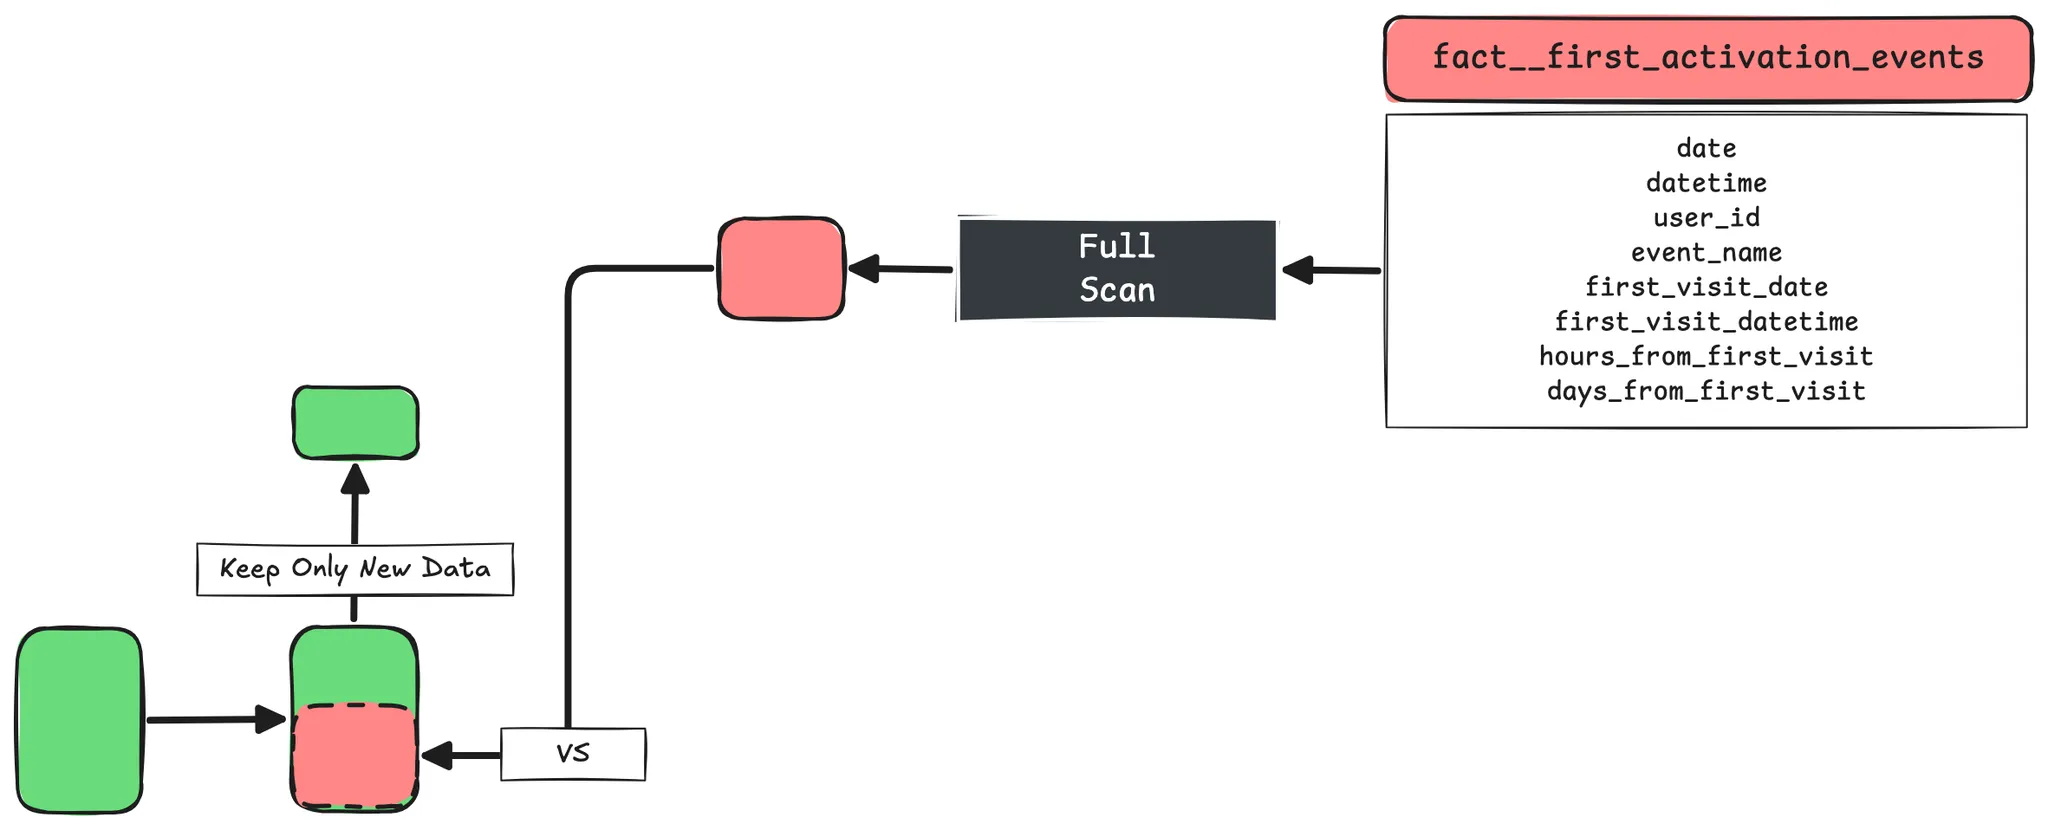
fact__eventsTable - 5.4. [STEP 4] Keep Only New First Key Events
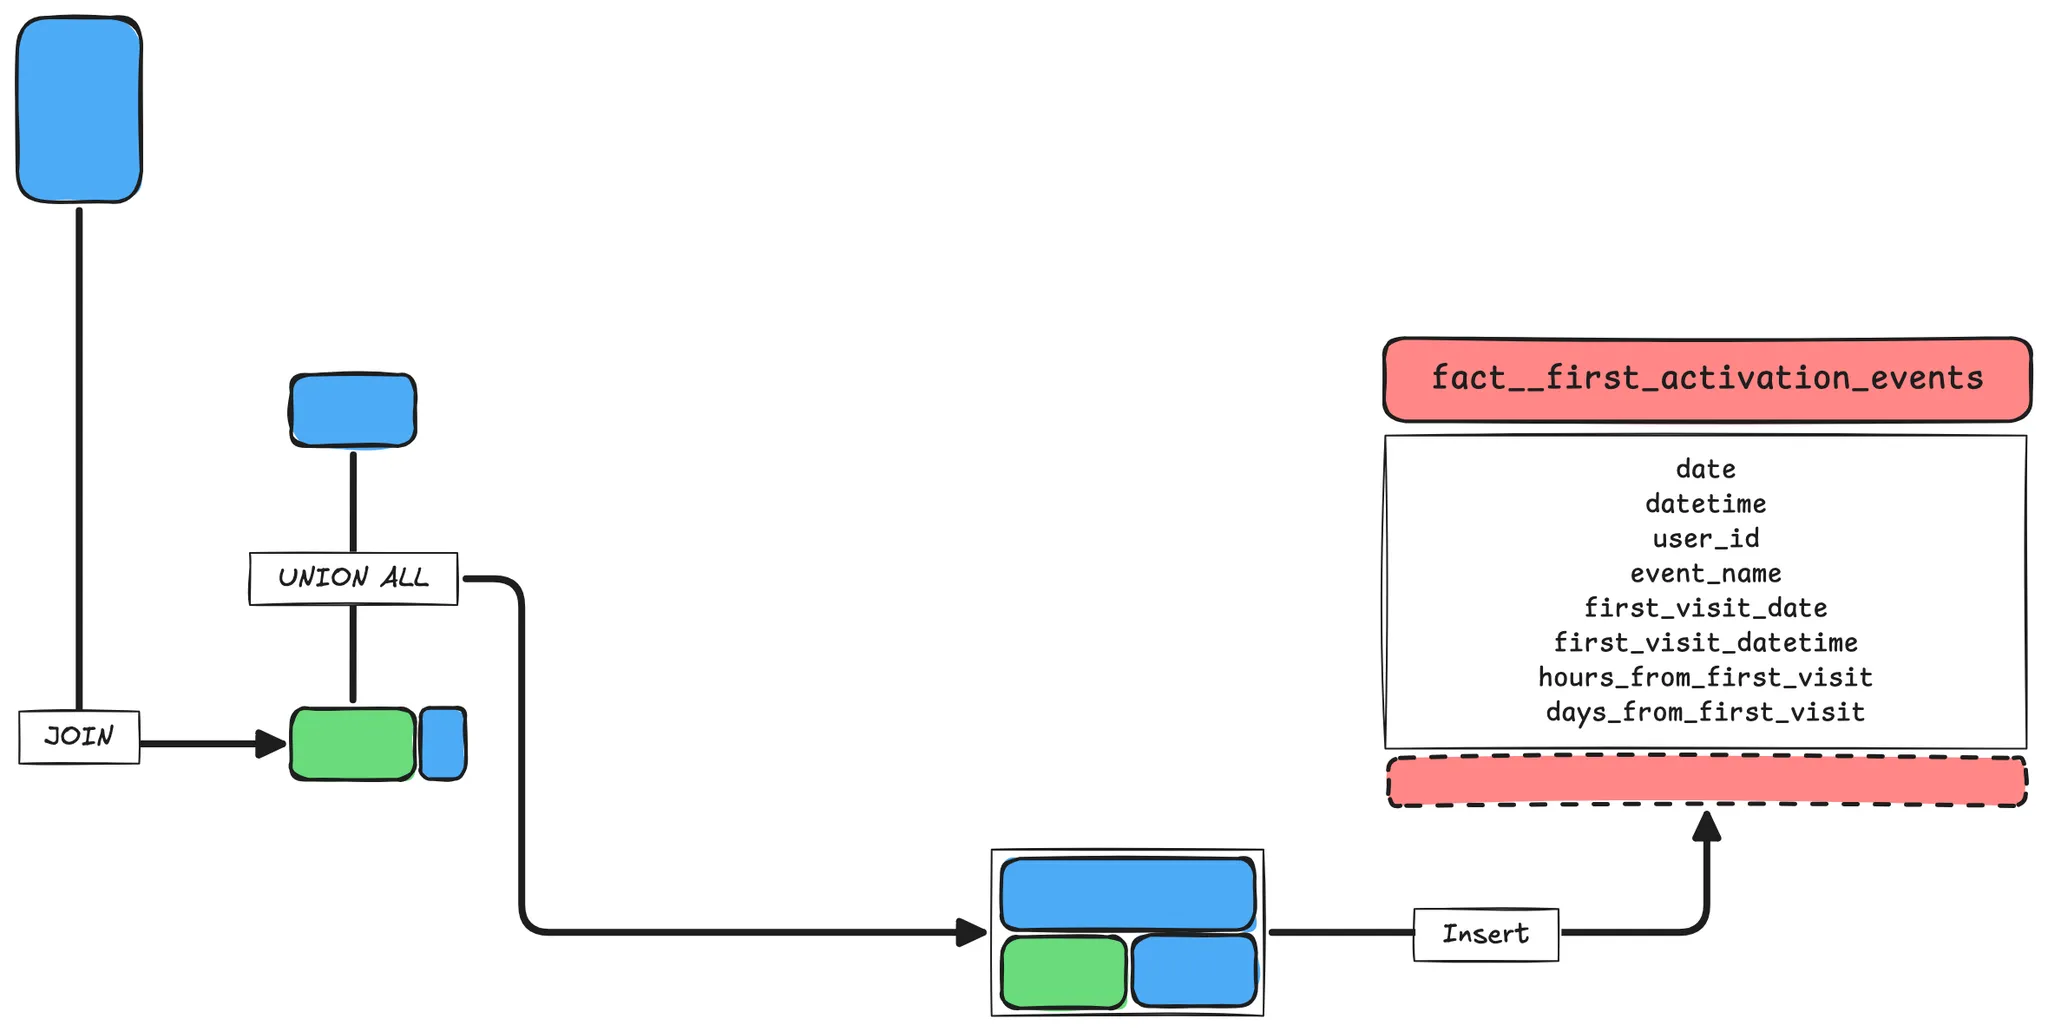
- 5.5. [STEP 5] Combine and Insert New
first_visitand First Key Events Data - 5.6. Final Review
- 5.1. [STEP 1] Load the Entire
- Modeling Review
- 6.1. Good Requirement Gathering Leads to Good Data Marts
- 6.2. Data Modeling Is Not Complete with Theory Alone
- Acknowledgements
- 7.1. Inspired by Toss Securities’ “DW Design Review” Video
- 7.2. Special Thanks to the Squad Leader
1. The Squad Organization Was Launched!
1.1. Background
Let’s focus not just on user acquisition, but on product improvements and marketing activities that lock in new users!
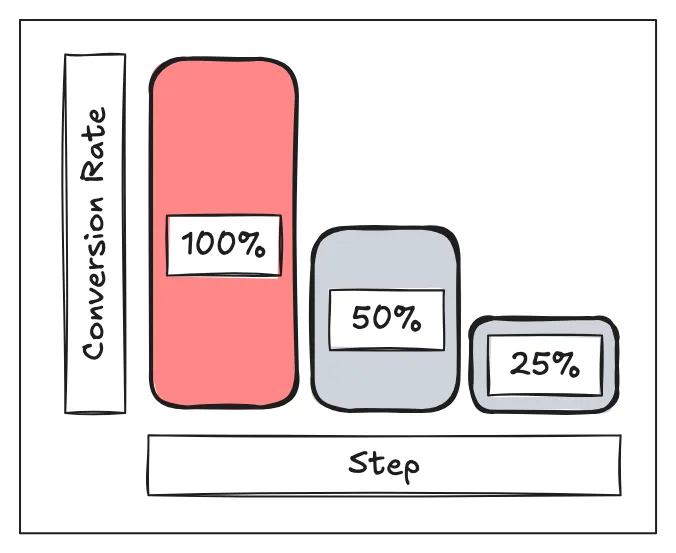
1.2. Core Metrics of the Squad
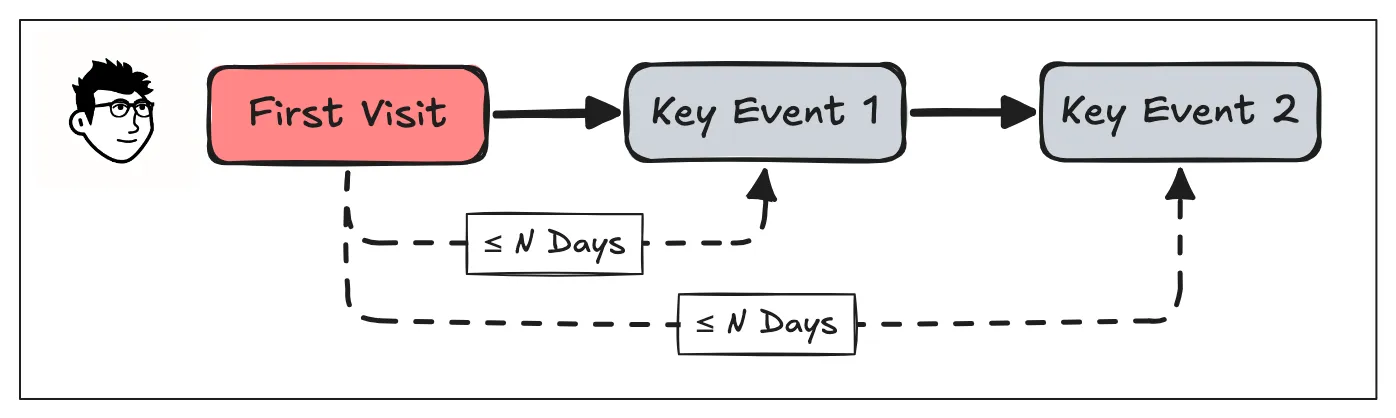
“Let’s increase the conversion rate of users who perform Key Event 1 within 1 day after their first visit, and Key Event 2 within 7 days!”
1.3. What the Data Analyst Needs to Do
“Please prepare the data so that we can thoroughly analyze the core metrics and provide them via dashboard.”
2. What I Needed to Do
2.1. Reflecting on the Core Metrics
- The sequence of First Visit - Key Event 1 - Key Event 2 is clear.
- Only conversions within the maximum conversion period are recognized.
- Conversion rates are measured on a user basis.
- The squad’s core metrics may change in the future: Key Events and maximum conversion periods.
2.2. Let’s Build a Data Mart!
- Running queries directly on the Core Layer’s
fact__eventswould be too complex and costly. - With the possibility of changes in core metrics, it would be difficult to control query accuracy and delivery.
3. A Preview of the Data Mart
3.1. dim__users
- Already managed as a conformed dimension in the Core Layer.
- SCD Type 1 (only the latest value is kept, no historical values).
| Column | Description |
|---|---|
user_id |
User ID |
first_date |
First visit date |
first_datetime |
First visit datetime |
country |
Most recent country |
device_os |
Most recent device OS |
app_version |
Most recent app version |
first_campaign |
UTM Campaign at first visit |
first_medium |
UTM Medium at first visit |
first_source |
UTM Source at first visit |
| … | … |
3.2. fact__first_activation_events
- This is a newly created table for this data mart.
- Only the first events for each user are stored.
| Column | Description |
|---|---|
date |
Date of first event occurrence |
datetime |
Datetime of first event occurrence |
user_id |
User ID |
event_name |
Event name |
first_visit_date |
User’s first visit date |
first_visit_datetime |
User’s first visit datetime |
hours_from_first_visit |
Hours elapsed from first visit to first event |
days_from_first_visit |
Days elapsed from first visit to first event |
3.3. Example Records
- If the
fact__eventstable looks like this for user Jinseok:
| date | datetime | user_id | event_name |
|---|---|---|---|
| 2025-01-01 | 2025-01-01 01:00:00 | Jinseok | first_visit |
| 2025-01-01 | 2025-01-01 01:01:00 | Jinseok | add_to_cart |
| 2025-01-02 | 2025-01-02 01:00:00 | Jinseok | add_to_cart |
| 2025-01-02 | 2025-01-02 01:01:00 | Jinseok | purchase |
- The
fact__first_activation_eventstable would be constructed as follows, keeping only the first events and adding necessary columns:
| date | datetime | user_id | event_name | first_visit_date | first_visit_datetime | hours_from_first_visit | days_from_first_visit |
|---|---|---|---|---|---|---|---|
| 2025-01-01 | 2025-01-01 01:00:00 | Jinseok | first_visit |
2025-01-01 | 2025-01-01 01:00:00 | 1 | 1 |
| 2025-01-01 | 2025-01-01 01:01:00 | Jinseok | add_to_cart |
2025-01-01 | 2025-01-01 01:00:00 | 1 | 1 |
| 2025-01-02 | 2025-01-02 01:01:00 | Jinseok | purchase |
2025-01-01 | 2025-01-01 01:00:00 | 25 | 2 |
3.4. Key Features
- This is a transaction fact table (since
user_idis present, you can easily filter dimensions viadim__users). - The grain is the combination of
user_idandevent_name(only the first event for each user is stored). - Conversion period information is stored as a pre-calculated non-additive fact (so you don’t need to use joins or window functions later).
4. Example Queries
4.1. Designed for Usability
- If the core metric’s Key Event changes? → Just modify the
event_namepart. - If the maximum conversion period changes? → Just modify the
hours_from_first_visitordays_from_first_visitpart. - Need to filter by user attributes? → Just join with
dim__users.
4.2. Beginner Query
- ☝🏻 Show the trend of users who converted via
key_event_1(regardless of conversion period).
    SELECT
        date,
        COUNT(1) AS users_cnt
    FROM
        fact__first_activation_events
    WHERE TRUE
        AND event_name = 'key_event_1'
    GROUP BY
        1
    ORDER BY
        1
4.3. Intermediate Query
- ☝🏻 Show the trend of conversion rates for users who performed
key_event_1within 1 day offirst_visit.
    SELECT
        first_visit_date AS cohort_date,
        COUNT(CASE WHEN event_name = 'first_visit' THEN 1 END) AS first_visit,
        COUNT(CASE WHEN event_name = 'key_event_1' THEN 1 END) AS key_event_1
    FROM
        fact__first_activation_events
    WHERE TRUE
        AND (
            event_name = 'first_visit'
            OR (event_name = 'key_event_1' AND days_from_first_visit <= 1)
        )
    GROUP BY
        1
    ORDER BY
        1
- ☝🏻 (Squad’s core metric) Show the trend of conversion rates for users who performed
key_event_1within 1 day andkey_event_2within 7 days offirst_visit.
    SELECT
        first_visit_date AS cohort_date,
        COUNT(CASE WHEN event_name = 'first_visit' THEN 1 END) AS first_visit,
        COUNT(CASE WHEN event_name = 'key_event_1' THEN 1 END) AS key_event_1,
        COUNT(CASE WHEN event_name = 'key_event_2' THEN 1 END) AS key_event_2
    FROM
        fact__first_activation_events
    WHERE TRUE
        AND (
            event_name = 'first_visit'
            OR (event_name = 'key_event_1' AND days_from_first_visit <= 1)
            OR (event_name = 'key_event_2' AND days_from_first_visit <= 7)
        )
    GROUP BY
        1
    ORDER BY
        1
4.4. Advanced Query
- ☝🏻 Show the trend of conversion rates for US users who performed
key_event_1within 1 day andkey_event_2within 7 days offirst_visit.
    SELECT
        FACT.first_visit_date AS cohort_date,
        COUNT(CASE WHEN FACT.event_name = 'first_visit' THEN 1 END) AS first_visit,
        COUNT(CASE WHEN FACT.event_name = 'key_event_1' THEN 1 END) AS key_event_1,
        COUNT(CASE WHEN FACT.event_name = 'key_event_2' THEN 1 END) AS key_event_2
    FROM
        fact__first_activation_events FACT
    LEFT JOIN
        dim__users DIM
        ON FACT.user_id = DIM.user_id
    WHERE TRUE
        AND DIM.country = 'United States'
        AND (
            FACT.event_name = 'first_visit'
            OR (FACT.event_name = 'key_event_1' AND FACT.days_from_first_visit <= 1)
            OR (FACT.event_name = 'key_event_2' AND FACT.days_from_first_visit <= 7)
        )
    GROUP BY
        1
    ORDER BY
        1
5. How the Modeling Was Done
5.1. [STEP 1] Load the Entire dim__users Table
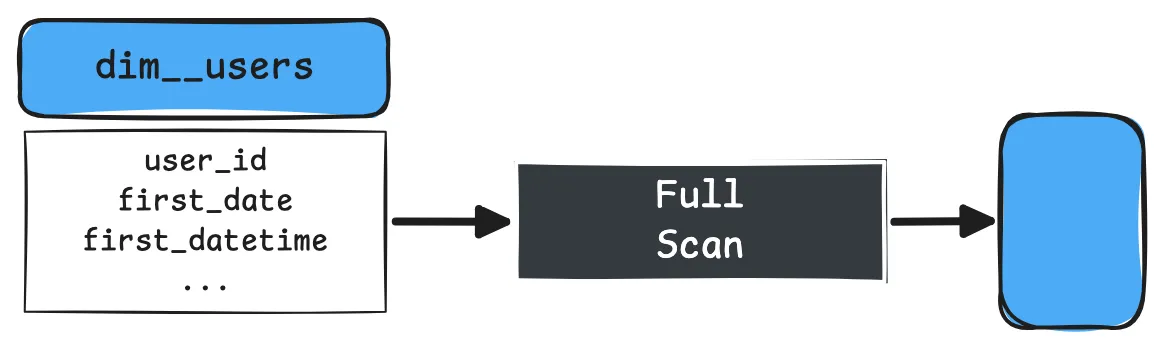
    WITH
    CTE_first_visits_raw AS (
        SELECT
            user_id,
            first_date AS date,
            first_datetime AS datetime
        FROM
            {{ ref('dim__users') }}
    ),
5.2. [STEP 2] Keep Only New first_visit Data
    {% if is_incremental() %}

    CTE_first_visits AS (
        SELECT
            SRC.user_id,
            SRC.date,
            SRC.datetime
        FROM
            CTE_first_visits_raw SRC
        LEFT JOIN
            {{ this }} EXISTING
            ON SRC.user_id = EXISTING.user_id
            AND EXISTING.event_name = 'first_visit'
        WHERE TRUE
            AND EXISTING.user_id IS NULL
    ),

    {% endif %}
5.3. [STEP 3] Incrementally Load the fact__events Table
    CTE_events_raw AS (
        SELECT
            user_id,
            event_name,
            MIN(date) AS date,
            MIN(datetime) AS datetime
        FROM
            {{ ref('fact__events') }}
        WHERE TRUE
            {% if is_incremental() %}
            AND datetime > (SELECT MAX(datetime) FROM {{ this }})
            {% endif %}
            AND event_name IN (
                'Key Event 1',
                'Key Event 2',
                ...
            )
        GROUP BY
            1, 2
    )
5.4. [STEP 4] Keep Only New First Key Events
    {% if is_incremental() %}
    ,

    CTE_events AS (
        SELECT
            SRC.*
        FROM
            CTE_events_raw SRC
        LEFT JOIN
            {{ this }} EXISTING
            ON SRC.user_id = EXISTING.user_id
            AND SRC.event_name = EXISTING.event_name
        WHERE TRUE
            AND EXISTING.user_id IS NULL
            AND EXISTING.event_name IS NULL
    )

    {% endif %}
5.5. [STEP 5] Combine and Insert New first_visit and First Key Events Data
    SELECT
        date,
        datetime,
        user_id,
        'first_visit' AS event_name,
        date AS first_visit_date,
        datetime AS first_visit_datetime,
        NULL AS hours_from_first_visit,
        NULL AS days_from_first_visit
    FROM
        {% if is_incremental() %}
        CTE_first_visits
        {% else %}
        CTE_first_visits_raw
        {% endif %}

    UNION ALL

    SELECT
        FCT.date,
        FCT.datetime,
        FCT.user_id,
        FCT.event_name,
        DIM.date AS first_visit_date,
        DIM.datetime AS first_visit_datetime,
        TIMESTAMP_DIFF(
            TIMESTAMP_TRUNC(FCT.datetime, HOUR),
            TIMESTAMP_TRUNC(DIM.datetime, HOUR),
            HOUR
        ) + 1 AS hours_from_first_visit, -- Starts from 1
        TIMESTAMP_DIFF(
            TIMESTAMP_TRUNC(FCT.datetime, DAY),
            TIMESTAMP_TRUNC(DIM.datetime, DAY),
            DAY
        ) + 1 AS days_from_first_visit -- Starts from 1
    FROM
        {% if is_incremental() %}
        CTE_events FCT
        {% else %}
        CTE_events_raw FCT
        {% endif %}
    INNER JOIN
        CTE_first_visits_raw DIM
        ON FCT.user_id = DIM.user_id
5.6. Final Review
models:
  - name: fact__first_activation_events
    description: User's first event history
    meta:
      owner: Jinseok Kim
    config:
      materialized: incremental
      incremental_strategy: insert_overwrite
      on_schema_change: append_new_columns
      partition_by:
        field: date
        data_type: date
        granularity: day
      time_ingestion_partitioning: true
      require_partition_filter: false
      copy_partitions: true
    columns:
      - name: date
        description: ...
      - name: ...
        description: ...
6. Modeling Review
6.1. Good Requirement Gathering Leads to Good Data Marts
- A good data mart = a data mart that can be used repeatedly and sustainably
- To accurately understand the squad’s core metrics, I spent hours discussing with the squad leader.
- How exactly is the conversion rate defined?
- How might the core metrics change in the future?
6.2. Data Modeling Is Not Complete with Theory Alone
- There are systematic theories for DWH such as Kimball and Inmon.
- However, the most important thing is: “Does it help solve the problem?”
- Organizational data usage tendencies, data characteristics, core problems
- The
fact__first_activation_eventstable was not created solely based on theory.- It was created by applying DWH theory to meet organizational needs.
7. Acknowledgements
7.1. Inspired by Toss Securities’ “DW Design Review” Video
Toss SLASH 24 - Designing and Operating a DW for All-Purpose Data Analysis
- This video provided important clues for understanding the flow of user activation data.
7.2. Special Thanks to the Squad Leader
- The squad leader actively helped resolve my questions to provide core metric data.
- Provided background to help see the business goals clearly.
- Carefully quantified the core metrics together.
- I am sincerely grateful for the intensive training that helped me align my perspective as a data analyst with the organization’s goals.
Published by Joshua Kim